Diagnostics and observability
Cheetah exposes several kinds of operational evidence because no single signal can explain a distributed command. A connection snapshot describes current presence. A pending RPC describes one caller that is still waiting. Delivery inspection describes admitted work and the machinery trying to reach a client. History records returned messages that reached retention. Tracing shows technical timing and parentage. The product's own records remain the authority for its business outcome.
These sources become useful when their boundaries remain visible. Turning them into one generic "health" flag would discard the distinction an investigation needs most.
Choose the evidence from the question
| Question | Start with | What it establishes | What it does not establish |
|---|---|---|---|
| Is the client present now? | registry diagnostics | the latest connection and runtime identity observed by the registry | that its send lane or handler is healthy |
| Is an application caller still waiting? | RPC diagnostics | a process-local or Redis-backed correlation record remains pending | that the client never acted |
| Is admitted work accumulating? | delivery diagnostics | bounded mailbox, reservation, node, and command-status evidence | the content of commands or external completion |
| What did the client return? | retained history | accepted progress, result, error, event, or state messages | every internal step or external side effect |
| Where did time or failure appear? | server traces and client telemetry | correlated technical events and parentage when signals were exported | durable or complete domain evidence |
| What happened in the target system? | product reconciliation | the product-specific state or external evidence it records | Cheetah transport details unless the product preserves them |
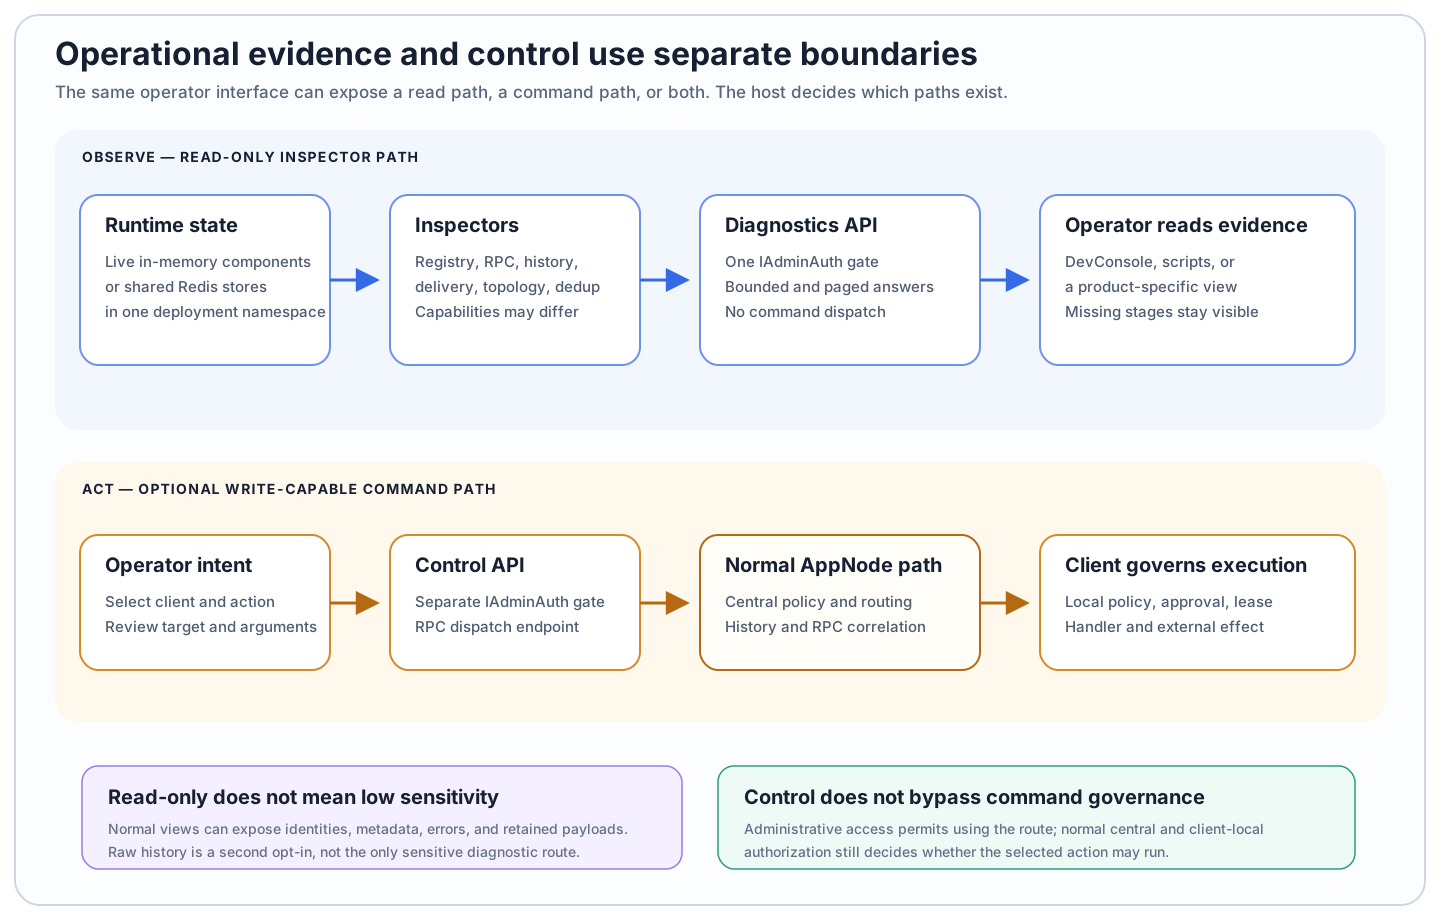
The diagnostics API is inspector-backed and read-only. A separately mounted control API can send real commands through an AppNode; enabling it changes the authority of the operator surface. The DevConsole can use either shape, which is why its read and control configuration must be reviewed separately.
Follow the reference in investigation order
Diagnostics API and security explains inspector composition, administrative authentication, capability discovery, bounded completeness, and response classes.
Live and retained evidence follows users, connections, advertised actions, pending RPCs, streams, messages, raw records, and deduplication without manufacturing a single completion verdict.
Delivery and worker topology covers command-delivery pressure, node health, trusted-scope reservations, contexts, browser windows, and worker assignment.
DevConsole and operator interfaces distinguishes the maintained dashboard, its read-only and control-enabled modes, the source-tree component boundary, and the older compatibility surfaces.
Server tracing defines the event-shaped span model, supplied tracer choices, explicit exporter configuration, and host-owned shutdown.
Client telemetry covers runtime sinks, negotiated endpoint handling, bounded loss, the application-owned receiver, and verification.
For a practical incident sequence, use Observe and diagnose. For evidence semantics along one command, start with Commands, acknowledgements, and delivery.